Explosive Intensification for Hurricane Polo
5 min read
Explosive Intensification for Hurricane Polo
Image of the Day for September 25, 2026Several ingredients came together off the Pacific coast of Mexico to generate one of the strongest storms the eastern Pacific basin has ever seen.
NASA Earth Observatory
Sep 25, 2026Article

 modis
mur sst
modis
mur sst
In mid-September 2026, Hurricane Polo began as a tropical disturbance off the Pacific coast of Mexico. By September 20, it was organized enough to qualify as a tropical depression, and by the next day it was a tropical storm.
From there, Polo launched into a period of rapid intensification that left meteorologists searching for adjectives strong enough to convey what was happening. Some described the storm's rate of intensification and strength as "jaw-dropping," others as "astonishing," and others as "absolute insanity."
"Polo went through a period of what can only be described as explosively rapid intensification," said Gary Partyka, an atmospheric scientist with the Global Modeling and Assimilation Office (GMAO) at NASA’s Goddard Space Flight Center, in an email. "This was RAPID, rapid intensification."
The storm was in an environment that was "near perfect" for strengthening, Partyka said, characterized by weak wind shear, high moisture, warmer ocean temperatures, and high levels of atmospheric instability.
Several observers leaned on extreme rapid intensification—a technical classification meaning the storm's wind speeds increased at least 60 knots (111 kilometers or 69 miles per hour) within a 24-hour period. By September 22, the storm’s maximum sustained wind speed had risen by 90 knots (167 kilometers per hour or 104 miles per hour) within 24 hours, hitting category 5 strength. In its normally staid forecast discussions, the National Hurricane Center called the intensification "truly remarkable."
When NOAA's Hurricane Hunter aircraft flew over the storm on September 22, researchers estimated winds of nearly 285 kilometers (180 miles) per hour. That would make it the third-strongest storm on record in the eastern Pacific by maximum sustained winds and the fastest on record to go from a tropical depression to a category 5 storm, according to some analysts.
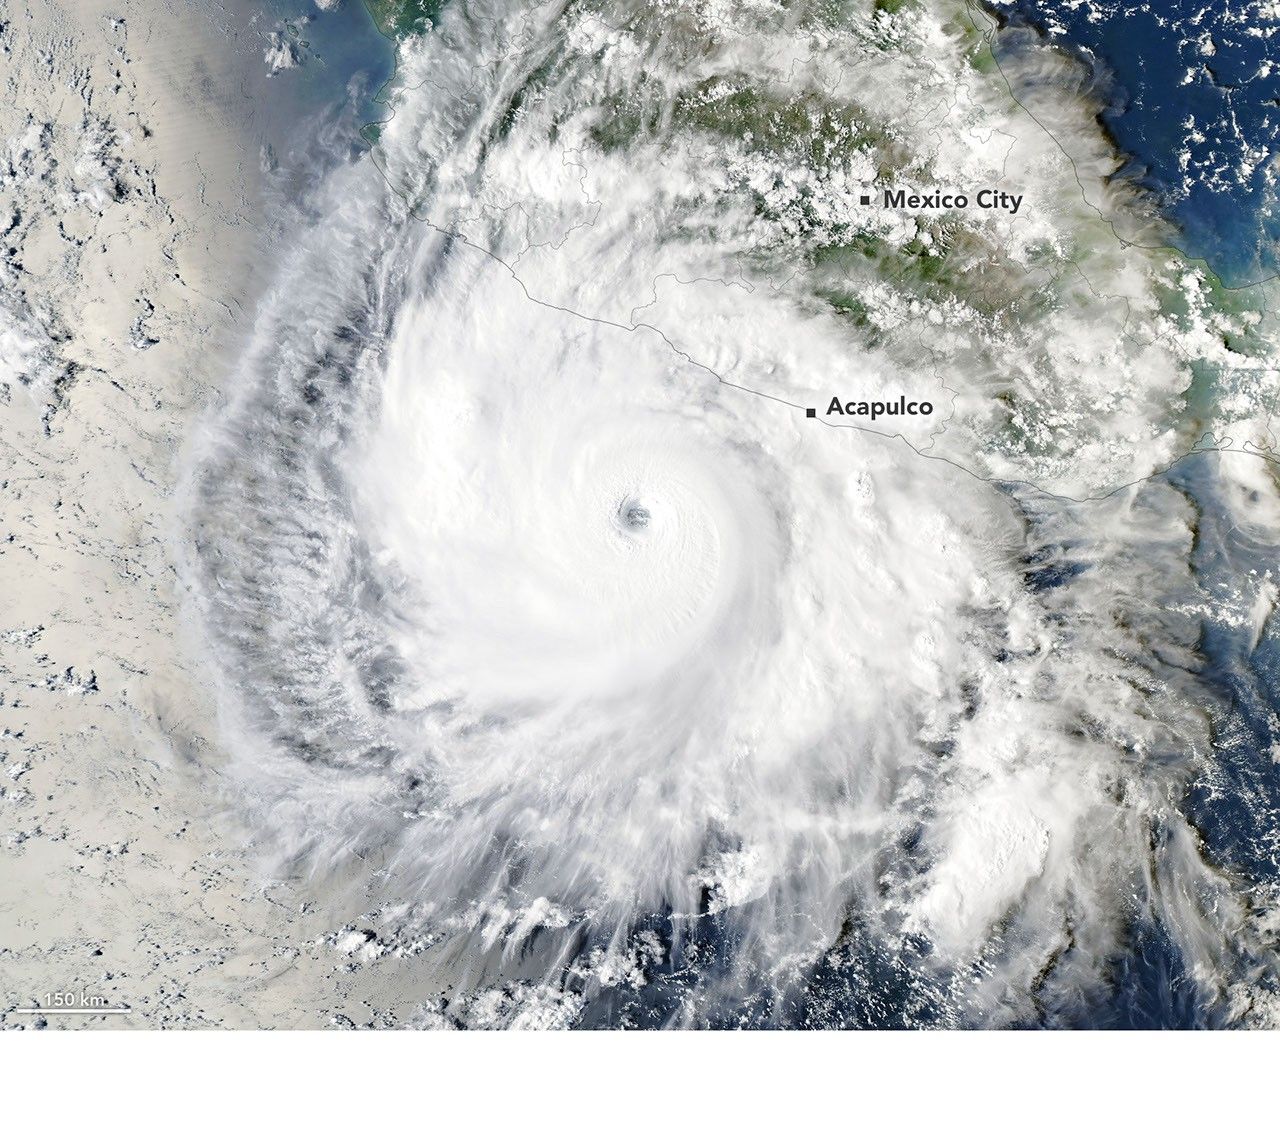
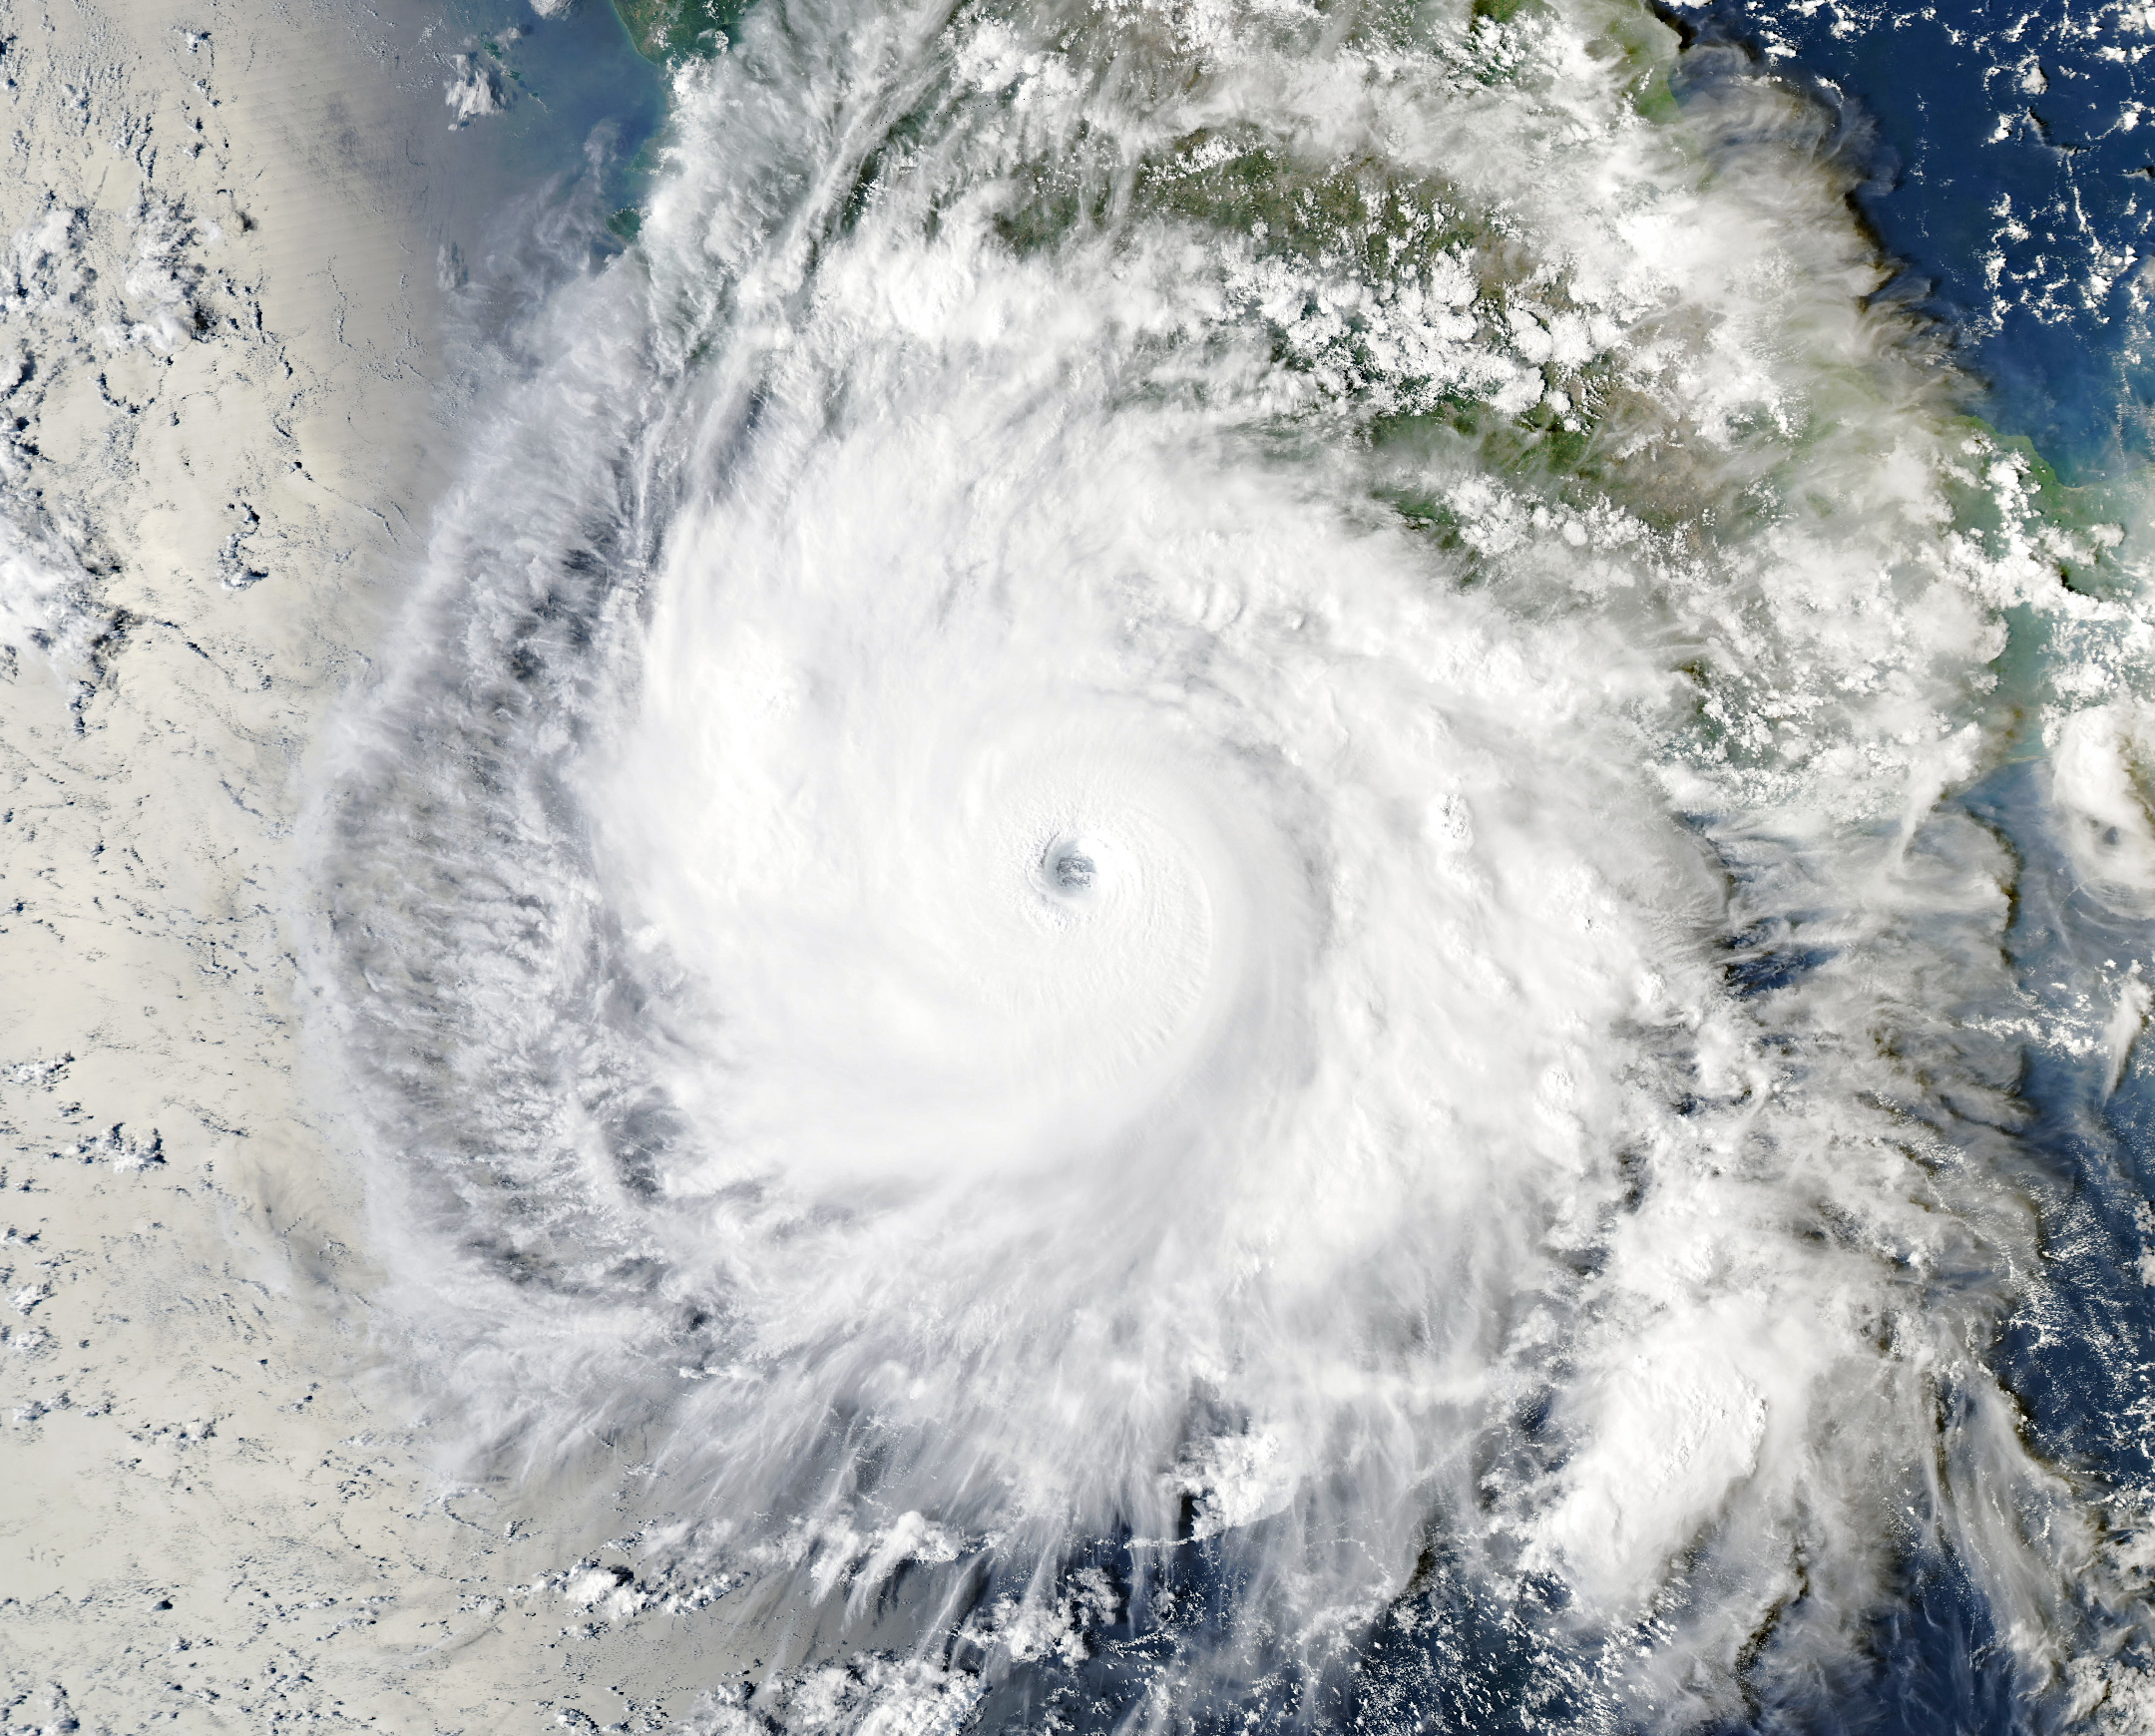
On the afternoon of September 23, when the Moderate Resolution Imaging Spectroradiometer (MODIS) on NASA's Aqua satellite captured this image (left), Polo was churning off the coast of Guerrero, southwest of Acapulco. With maximum sustained winds of 230 kilometers (145 miles) per hour, the storm was category 4 strength when the image was acquired, having undergone an eyewall replacement cycle that weakened it slightly.
“The satellite imagery of Polo is very impressive, with the storm’s large, clear eye and extensive outflow pattern,” said Kristen Corbosiero, an atmospheric scientist at the State University of New York at Albany, who is working on a NASA project that uses satellite data to study tropical cyclone ventilation. “Weak winds above the system and good outflow at the top of the system also contributed to Polo's rapid intensification.”
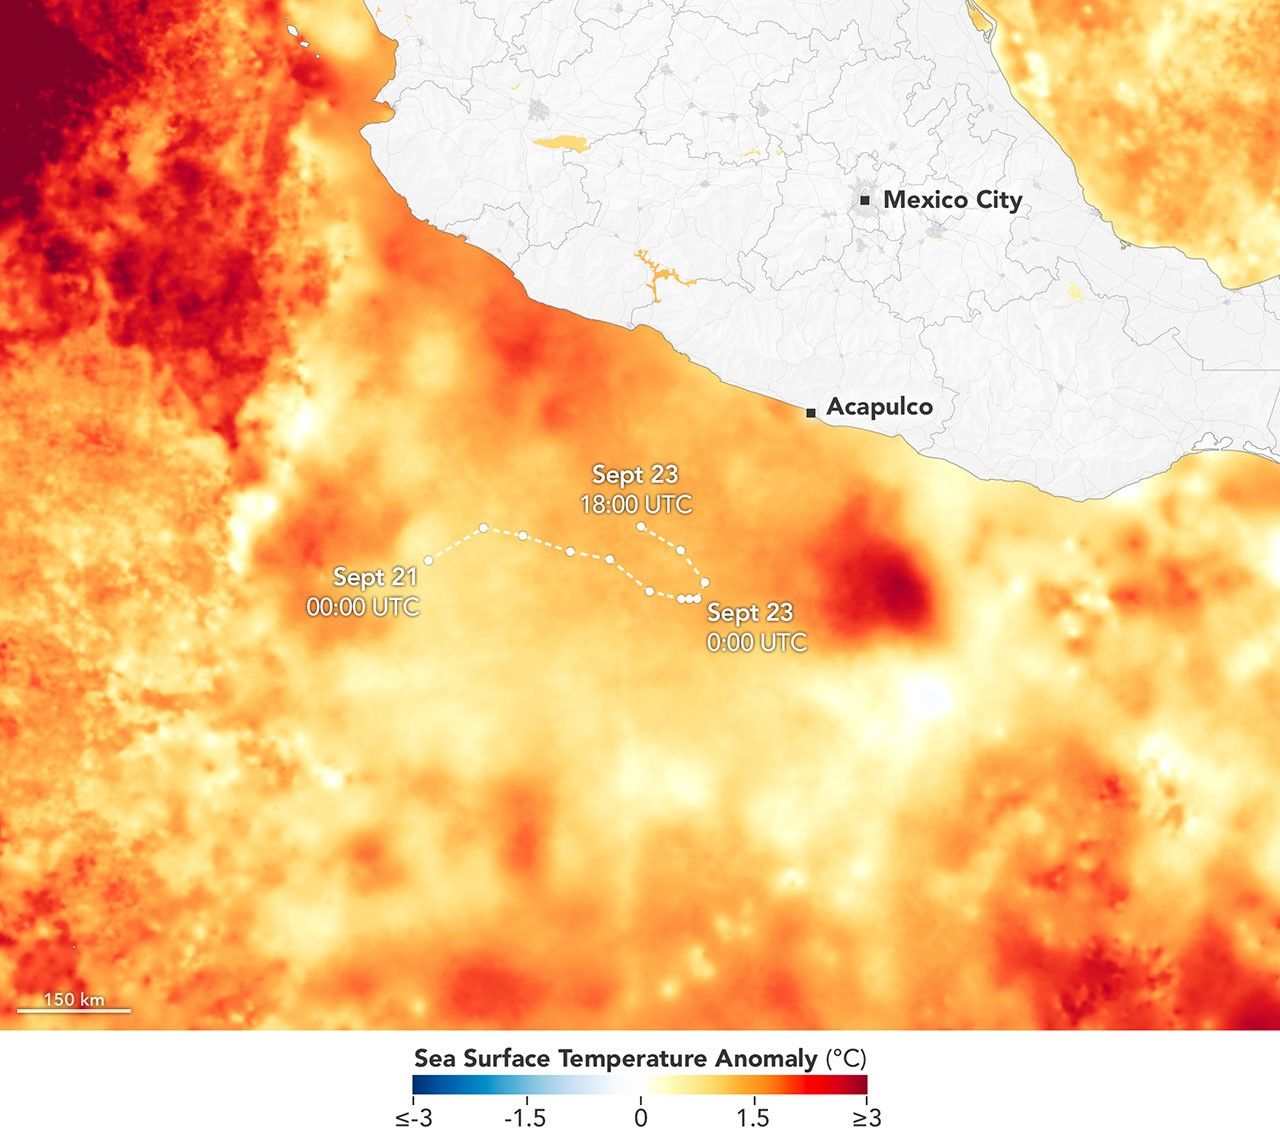
As Polo developed, it moved over areas where sea surface temperatures were as high as 32 degrees Celsius (90 degrees Fahrenheit)—2 to 3 degrees warmer than usual for September 23. Surface waters across much of the region were above 27.8°C (82°F), the temperature generally required to sustain and intensify hurricanes.
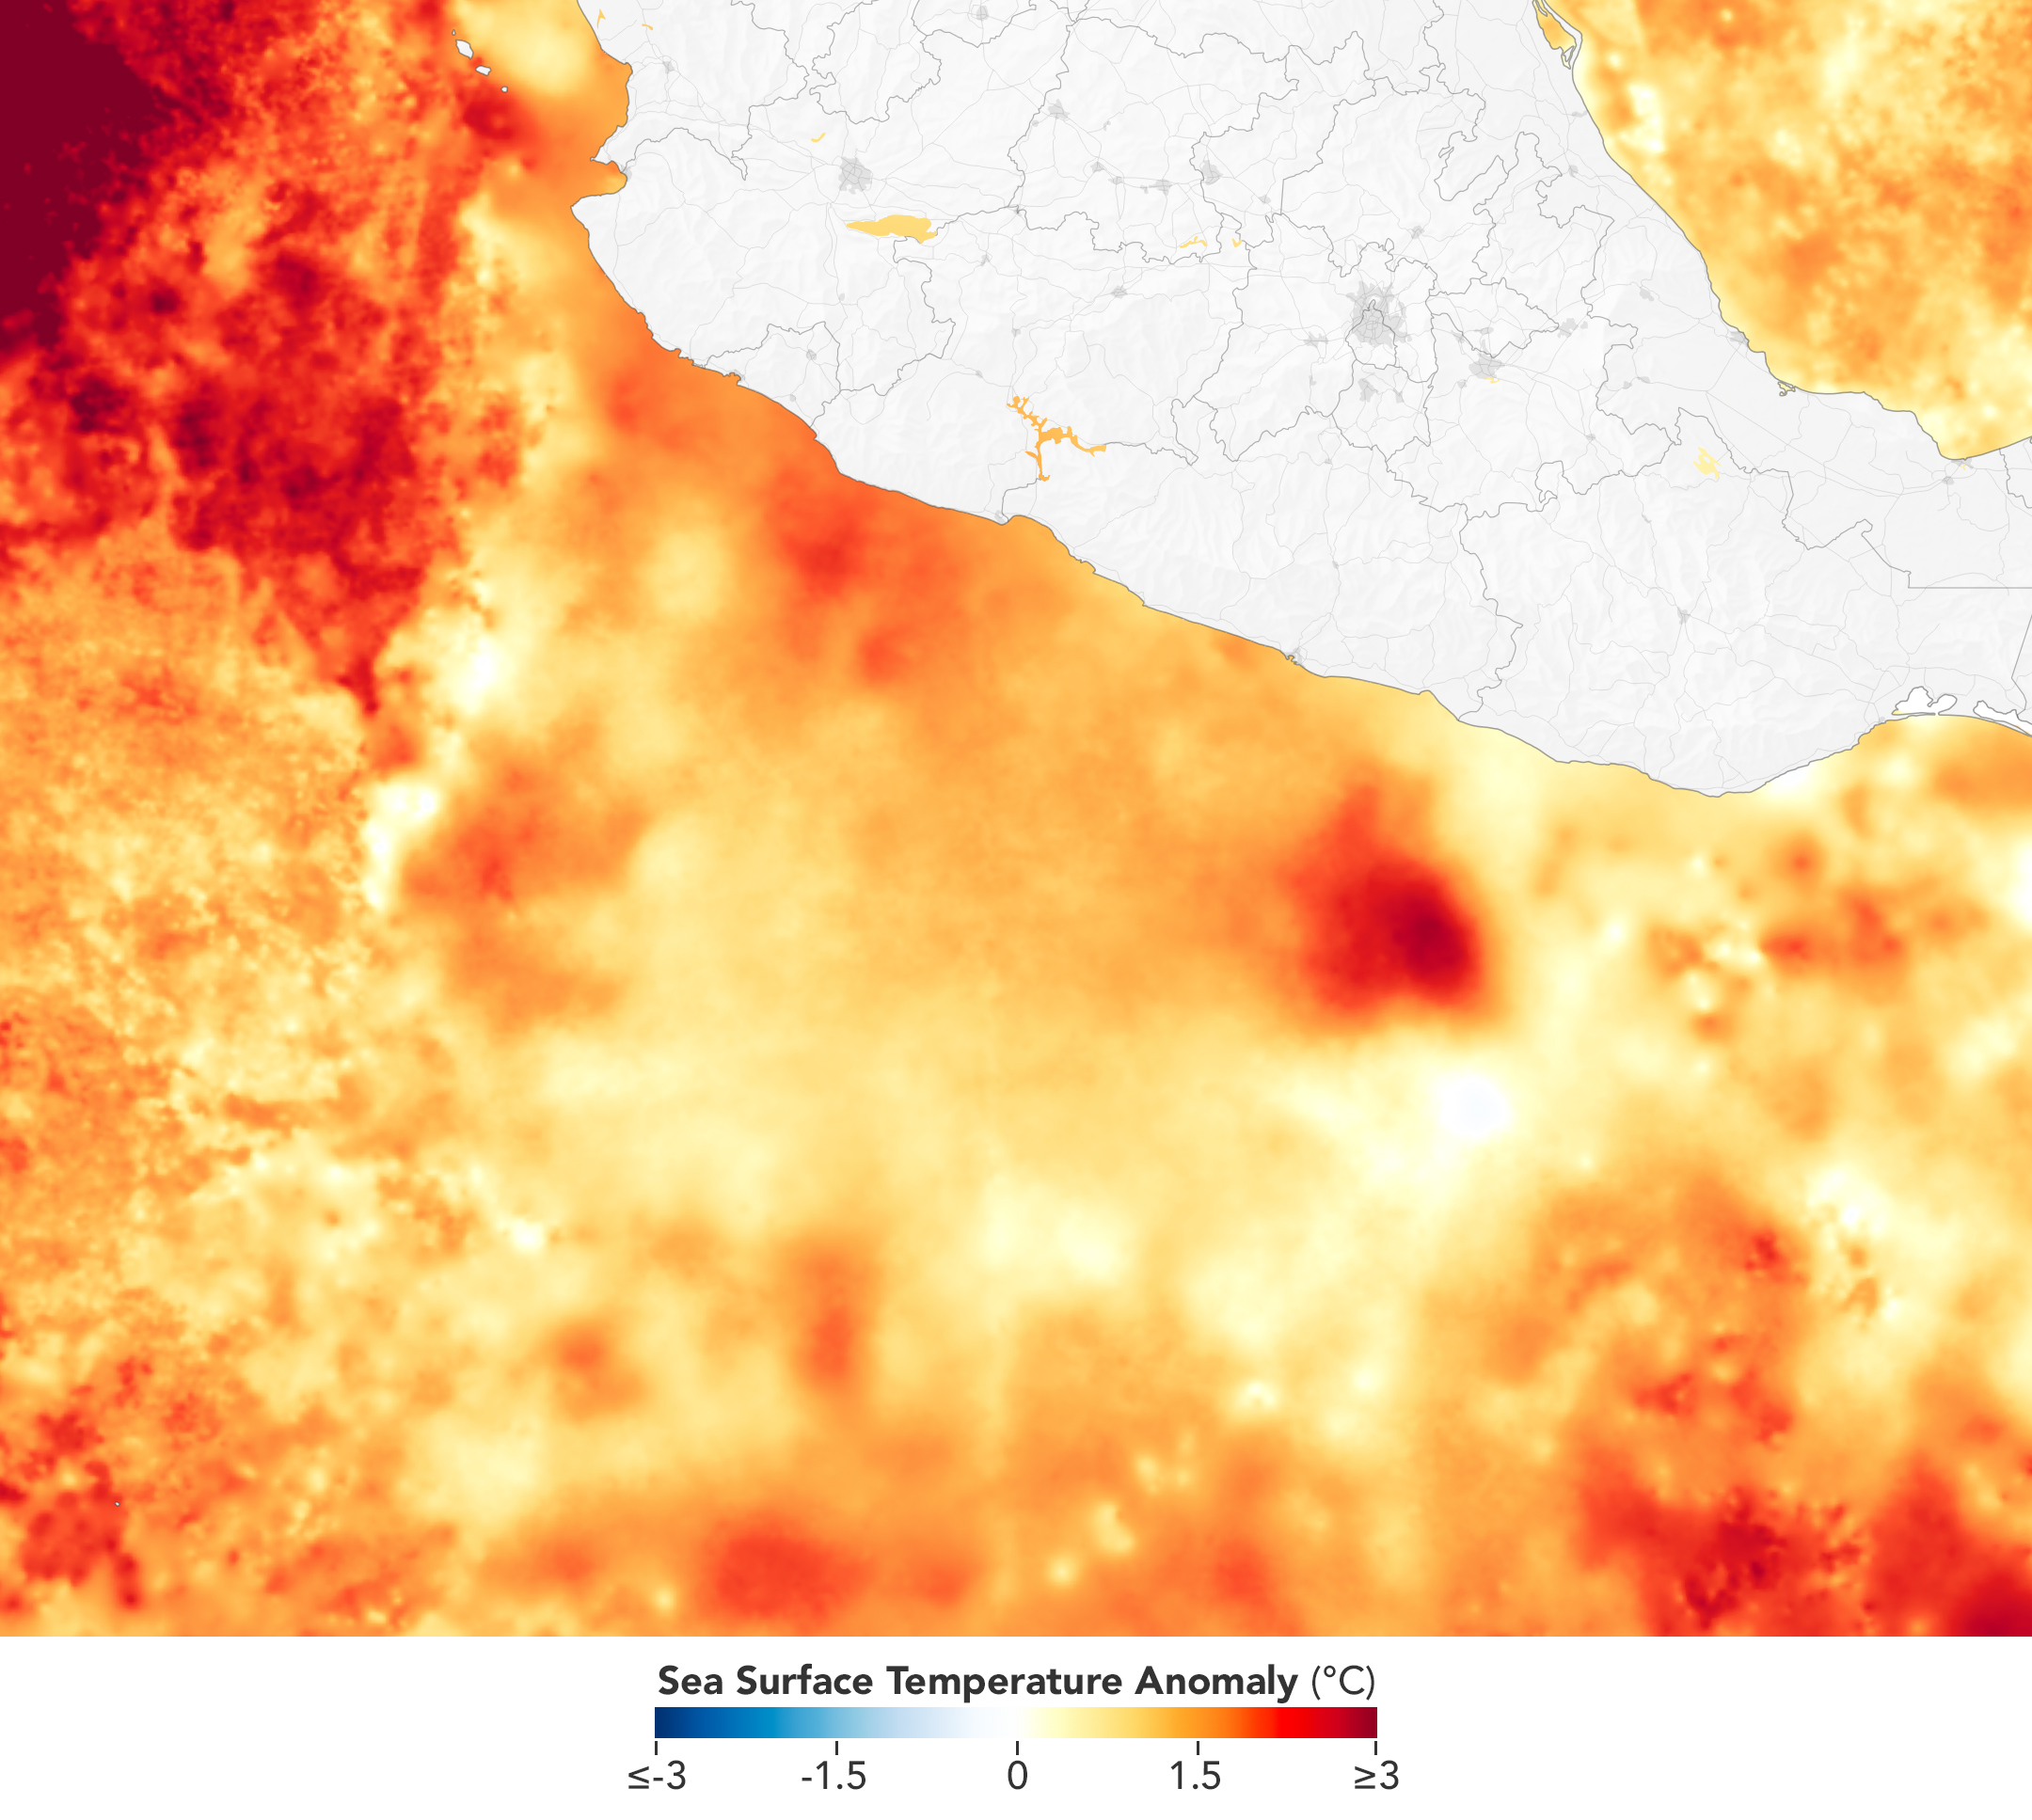
The map above (right) is based on data from the Multiscale Ultrahigh Resolution Sea Surface Temperature (MUR SST) project at NASA’s Jet Propulsion Laboratory, which blends satellite measurements from NASA, NOAA, and international missions with observations from ships and buoys. Rather than absolute temperatures, the map shows anomalies—how much warmer or cooler the ocean surface was on September 23, 2026, than the project’s 2003-2014 average for that date.
While the map above conveys temperatures at the water surface, the presence of warm water deeper in the column has likely contributed to the storm's staying power, Corbosiero added. Sometimes hurricanes churn up cooler water from deep in the column that can slow a storm's intensification, but in this case the cool water wake behind the storm appears minimal, and measurements and models show high ocean heat content at considerable depths.

Both Partyka and Corbosiero cautioned against attributing Polo's rapid intensification directly to El Niño’s unusually warm surface temperatures in the central and eastern Pacific Ocean. Several hurricanes in this region have undergone rapid intensification in the past during La Niña and neutral conditions, Corbosiero noted, including Hurricane Otis in 2023 and Patricia in 2015, both category 5 storms.
However, the overall amount of tropical cyclone activity in the eastern Pacific does typically increase during El Niño due to changes in large-scale ocean and atmospheric circulation patterns, and that's what has happened so far in 2026. As of September 24, the accumulated cyclone energy in the region was nearly twice the norm, according to data from Colorado State University.
People tracking sea surface temperature anomalies or other aspects of the storm can do so using NASA's Worldview browser, a near real-time data viewer from the Short-term Prediction Research and Transition (SPoRT) project, and the FLUID tool from GMAO. Forecasters expect Polo to stay over the Pacific until next week, when it may curve toward the northeast and approach Baja California.
NASA Earth Observatory images by Michala Garrison, using sea surface temperature data from the Multiscale Ultrahigh Resolution (MUR) project, MODIS data from NASA EOSDIS LANCE and GIBS/Worldview, and storm track data from NOAA's National Hurricane Center. Story by Adam Voiland.
Downloads
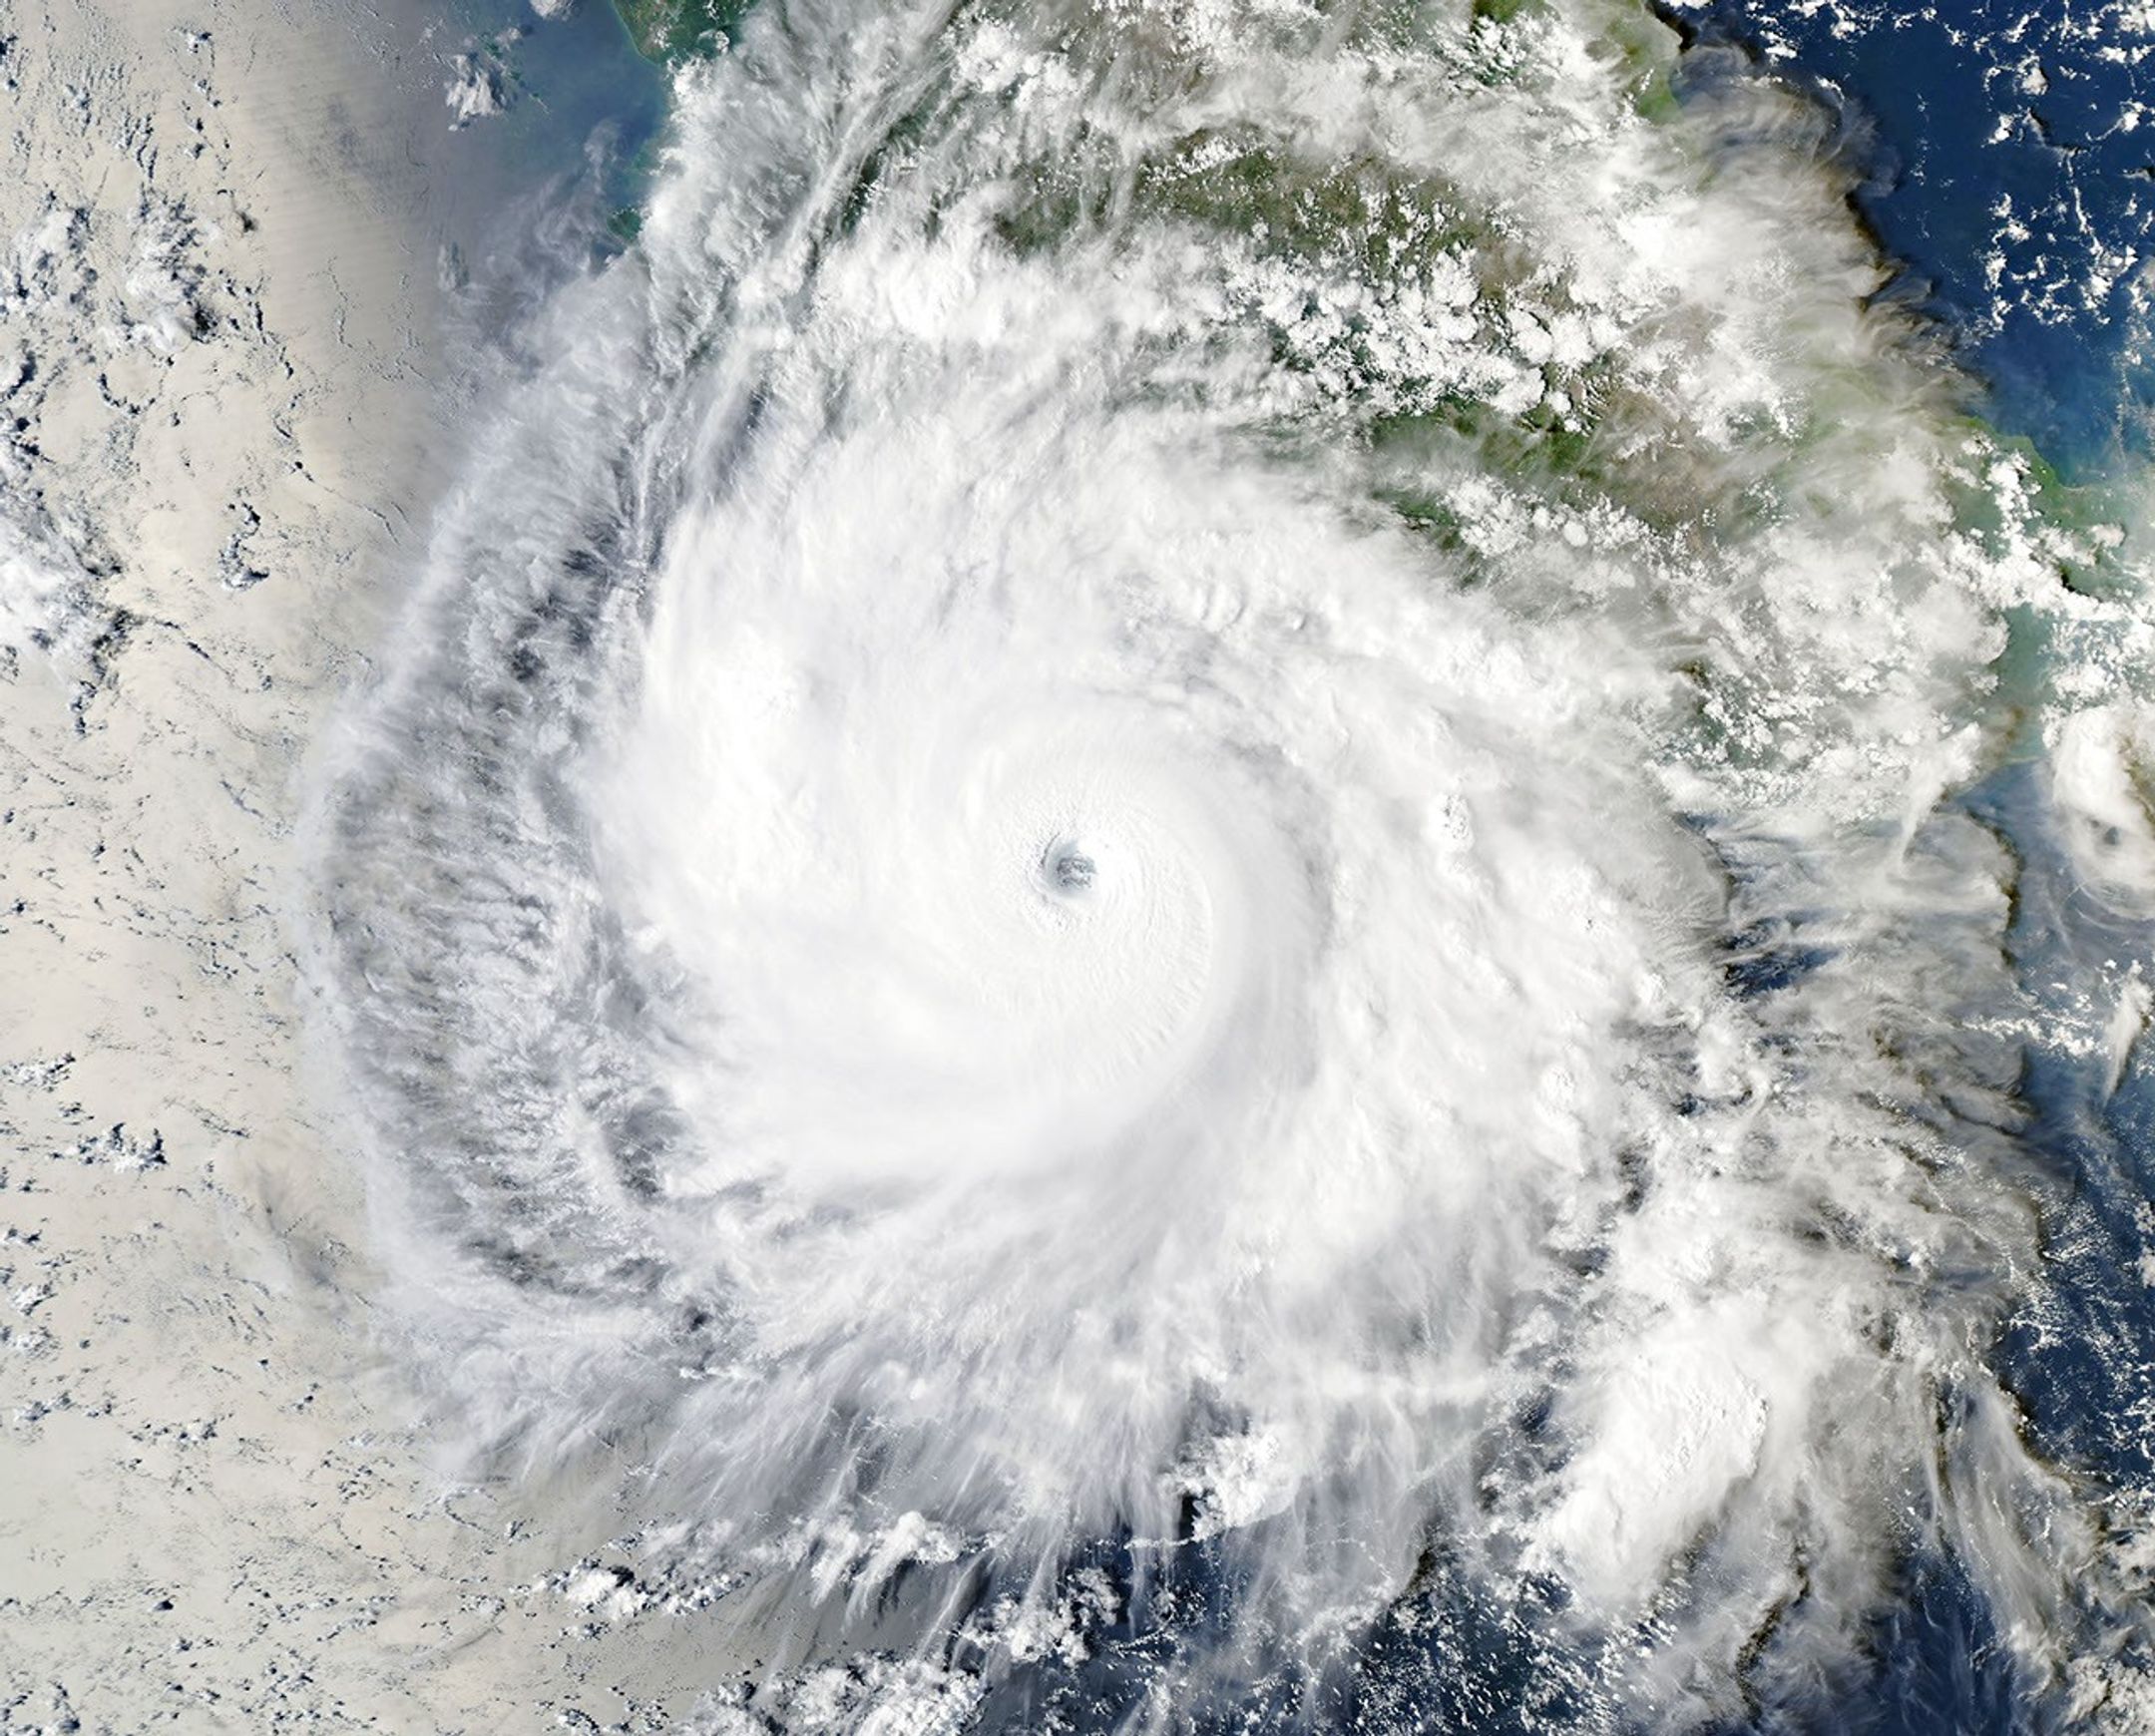
September 23, 2026: MODIS Natural Color
JPEG (2.55 MB)
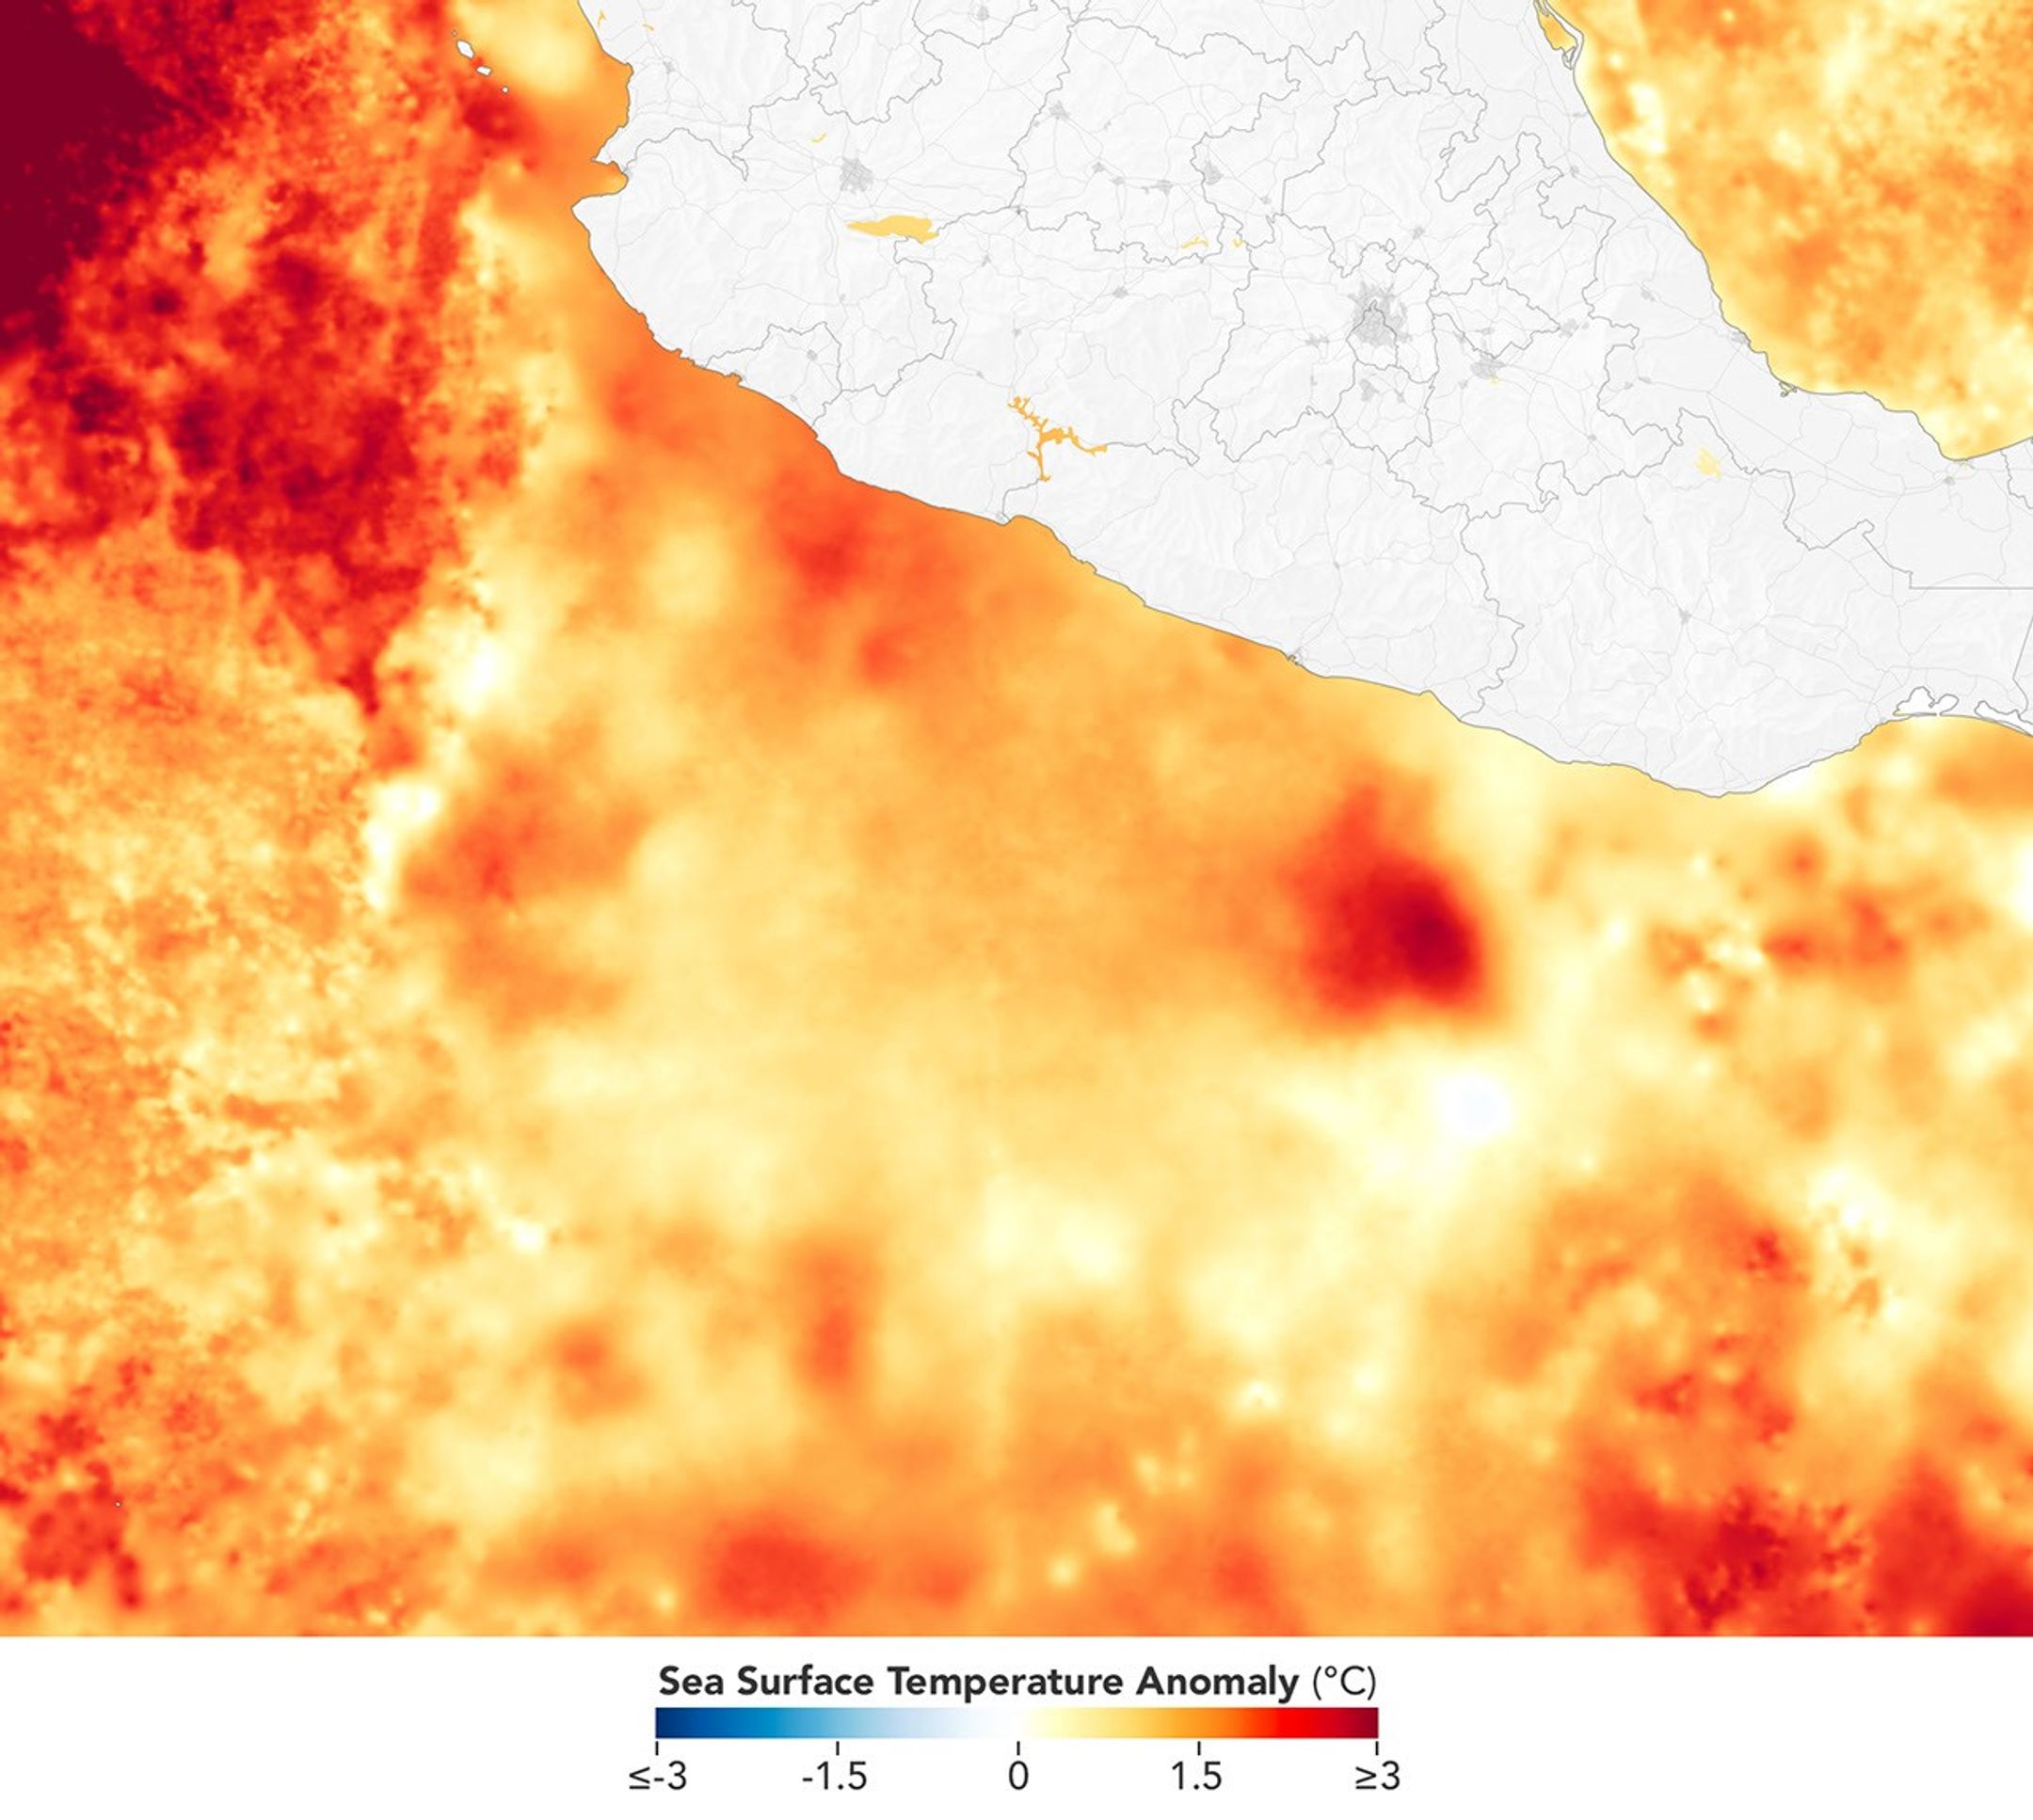
September 23, 2026: MUR Sea Surface Temperatures
JPEG (1.20 MB)
References & Resources
- Colorado State University (2026, September 23) Real-Time Northeast Pacific Ocean Statistics by Storm for 2026. Accessed September 24, 2026.
- Cooperative Institute for Research in the Atmosphere (2026) Polo. Accessed September 24, 2026.
- Eye on the Tropics (2026, September 23) Polo Puts on a Show Over the Eastern Pacific. Accessed September 24, 2026.
- Forbes (2026, September 22) Explosive Hurricane Polo Could Remain Category 5 For Days. Accessed September 24, 2026.
- Meir, J., via X (2026, September 24) Hurricane Polo is looking massive from the @Space_Station cupola. Accessed September 24, 2026.
- NASA Earthdata Tropical Cyclones. Accessed September 24, 2026.
- National Hurricane Center (2026) Hurricane POLO Advisory Archive. Accessed September 24, 2026.
- Stern, D., et al. (2026) Distinguishing Tropical Cyclone Extreme Rapid Intensification from Ordinary Rapid Intensification. Monthly Weather Review, 154(10), 2133-2149.
- The Washington Post (2026, September 22) Hurricane Polo intensified to a Category 5 in less than a day. Accessed September 24, 2026.
- Yale Climate Connections (2026, September 23) Powerful Hurricane Polo threatens Mexico with torrential rain as Pacific tropics erupt. Accessed September 24, 2026.
You may also be interested in:
Stay up-to-date with the latest content from NASA as we explore the universe and discover more about our home planet.
The powerful storm delivered extreme rainfall and damaging winds to the state, passing the Island of Hawaiʻi as a category…
Article
The first named storm of the 2026 Atlantic hurricane season brought intense rainfall and the threat of flash flooding to…
Article
The Pacific was buzzing with storms while the Atlantic was notably quiet.
Article Keep ExploringDiscover More from NASA Earth Science
Subscribe to Earth Observatory Newsletters
Subscribe to the Earth Observatory and get the Earth in your inbox.

Earth Observatory Image of the Day
NASA's Earth Observatory brings you the Earth, every day, with in-depth stories and stunning imagery.

Explore Earth Science

Earth Science Data
Open access to NASA’s archive of Earth science data
